Unusual Schumann Resonance Chart “Whiteout” on Feb. 7 Sparks Questions, But Experts Urge Caution on Causes
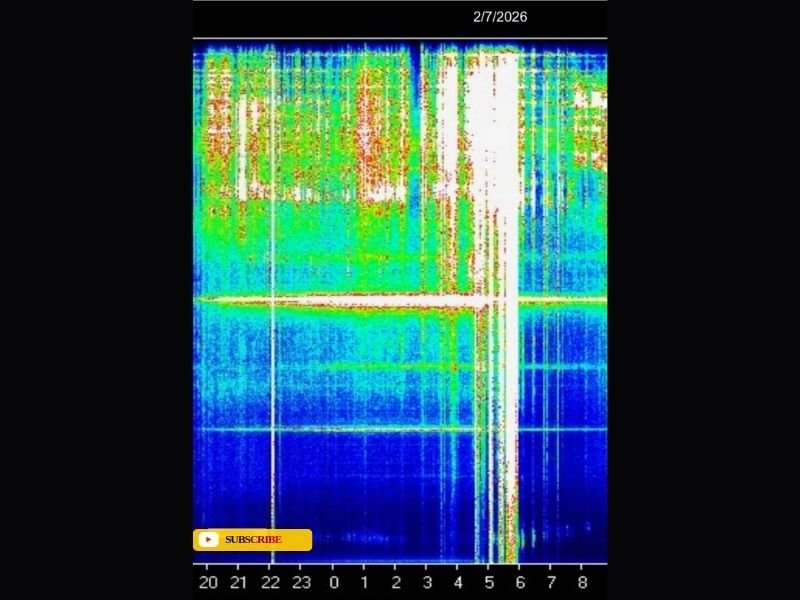
UNITED STATES — A widely shared Schumann Resonance chart dated 2/7/2026 is drawing attention online after appearing to show broadband “saturation” — tall, bright white columns that suggest the monitoring system was overwhelmed across multiple frequencies at once, rather than a quick, narrow spike.
What the Feb. 7 Chart Is Showing — and Why People Noticed
Posts circulating with the image describe it as “not a typical spike,” emphasizing that it wasn’t a quick burst, wasn’t localized noise, and didn’t reset the baseline afterward. The same posts note that the core resonance bands still appear present, but that another layer of signal seems to sit on top of them for a sustained period — the visual “whiteout” effect.
Why “Saturation” Doesn’t Automatically Mean One Clear Cause
Schumann Resonance monitors can display dramatic-looking patterns for several reasons, and a chart like this doesn’t, by itself, prove a specific event. Saturation-style displays can occur when instruments pick up strong interference, changes in background electrical noise, or system limitations where the sensor is unable to cleanly separate signals. That’s why meteorologists and space-weather watchers often treat these viral charts as a “watch item” rather than a firm conclusion.
Possible Drivers Mentioned in the Post
The accompanying write-up points to several broad possibilities that can align with system-wide stress signatures, including:
- Ionospheric disturbance
- Strong solar–magnetosphere coupling
- Atmospheric conductivity shifts
Importantly, the same post also states: “No conclusions being drawn. This is documentation.”
What Readers Should Do If They’re Feeling “Off”
Some social posts tie charts like this to personal symptoms such as sleep disruption, ringing ears, or feeling unusual pressure changes. While those experiences are real for the people reporting them, a single chart image can’t confirm a medical or environmental cause. If you’re feeling unwell, it’s smart to treat it like any other health concern: hydrate, rest, and contact a professional if symptoms persist or worsen. For those simply curious about timing, compare viral posts against official space-weather and geomagnetic updates rather than relying on screenshots alone.
If you’ve been seeing odd sky conditions, radio interference, or just a noticeable “off” feeling where you live, share what you’re noticing — and keep following SaludaStandard-Sentinel.com for clear explainers when the next update drops.