Tornado Alley Map Shows Higher Risk Spreading Into the Southeast, Including Alabama, Mississippi, Tennessee, and the Carolinas
UNITED STATES — New long-term tornado probability data is fueling fresh discussion about how “Tornado Alley” is being defined, with a widely shared map showing elevated annual risk stretching well beyond the traditional central Plains and deeper into the Southeast and Midwest.
What the New Map Is Showing
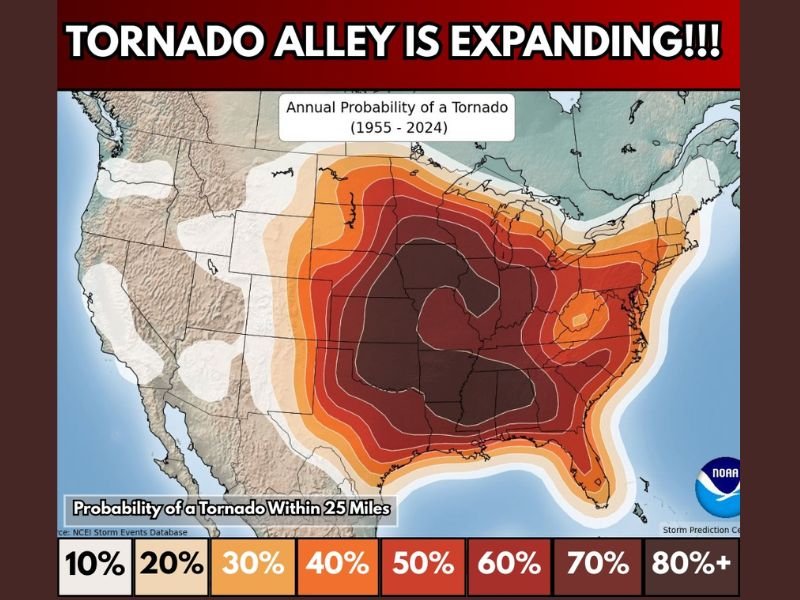
The graphic is labeled “Annual Probability of a Tornado (1955–2024)” and displays the probability of a tornado within 25 miles of a given location. The color scale ranges from 10% on the low end to 80%+ on the highest end.
What stands out is the size of the higher-probability area across the middle of the country, with the darkest shading centered over parts of the central U.S. and a broad band of elevated risk reaching into the Lower Mississippi Valley and parts of the South.
Why People Are Saying “Tornado Alley Is Expanding”
On social media, the map is being described as evidence that “Tornado Alley is expanding.” The most accurate way to read it is that the corridor of higher long-term tornado probability is not limited to one narrow strip of states—and that large portions of the Southeast now sit inside meaningful probability zones, rather than being treated as separate from the classic Plains-focused idea.
That’s where terms like “Dixie Alley” come in—used by many weather communicators to describe the tornado-prone corridor that can include Mississippi, Alabama, Tennessee, and parts of Georgia.
“Micro-Alleys” Like Dixie, Hoosier, and Carolina Alley
The post connected to the graphic also mentions “micro-alleys,” describing how tornado-prone zones can shift by season and month. In that framing, areas sometimes referenced include Hoosier Alley across parts of the Midwest and a Carolina-focused corridor farther east.
The map reflects that idea by showing pockets of enhanced probability outside the central Plains, including parts of the Southeast and sections of the East where the colors intensify.
What This Means for Residents
The biggest takeaway is not panic—it’s preparedness. If your area sits in one of the higher color bands, it’s a reminder that tornado readiness isn’t just a Plains issue. Knowing your safe place, having weather alerts enabled, and reviewing family plans before spring storms ramp up can make a real difference when warnings are issued.
Do you know the tornado probability where you live, and does this map match what you’ve experienced in recent years? Share your thoughts and join the conversation at SaludaStandard-Sentinel.com.